Gross domestic product
To create an effective presentation on Gross Domestic Product, consider the following:
1. Start Here
Most GDP data comes from the Bureau of Economic Analysis. For survey-based forecast data, see the Survey of Professional
Forecasters. For information about Potential GDP, see FOMC projections and the Congressional Budget Office.
2. Analyze By components
One of the most effective (i.e. Aeimit's favorite) way to do this is through a bar graph of this format. (This is taken from Econbrowser):
You may have to re-create this graph yourself. Most of this data can be found on the Bureau of Economic Analysis's website or FRED.
Things to note:
1. Changes in consumption are measured by changes in Real Personal Consumption Expenditures. This is different from
the index that measures inflation!
2. If you're looking to analyze consumption further, look at durable goods spending and changes in consumer credit.
Strong numbers here are often cited as indicators of good times.
3. Investment spending is divided into three categories. In terms of recession recovery, pay special attention to Residential/
Nonresidential Fixed Investment. These figures tend to signal both economic problems and recovery.
3. Analyze by Sector
In some instances, it may be valuable to analyze the welfare of certain key economic sectors. However, remember that it is not part of
the Fed's statutory mandate to protect any one industry, except as it relates to overall economic well-being.
Housing
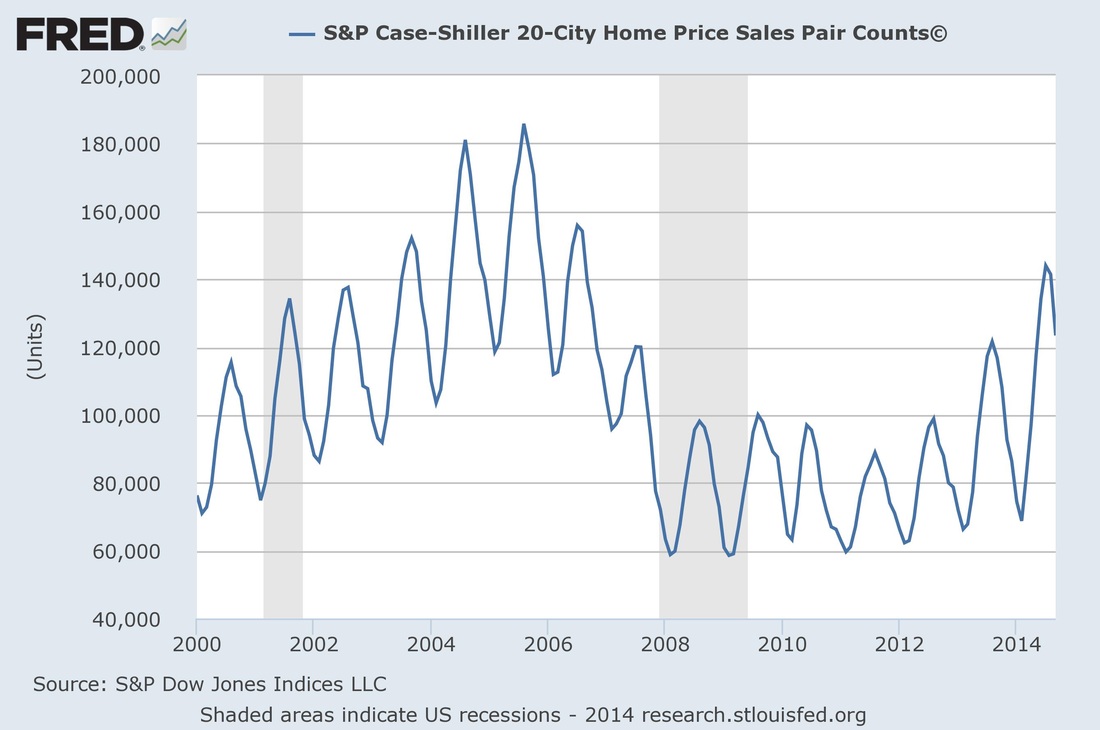
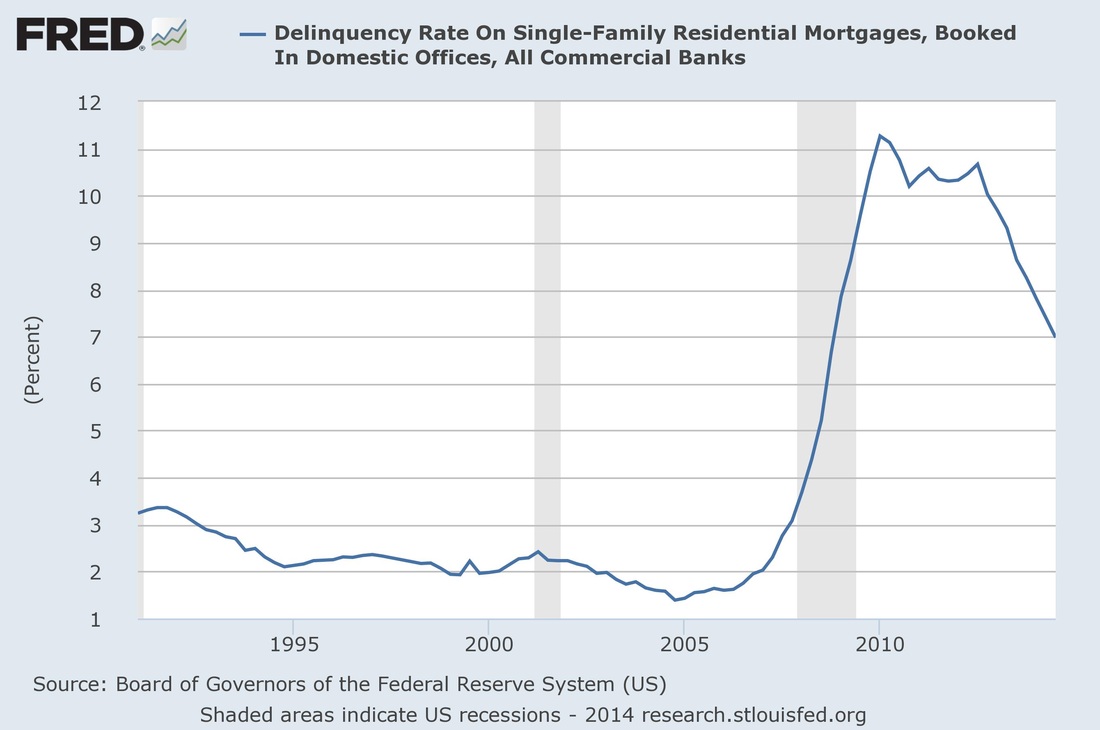
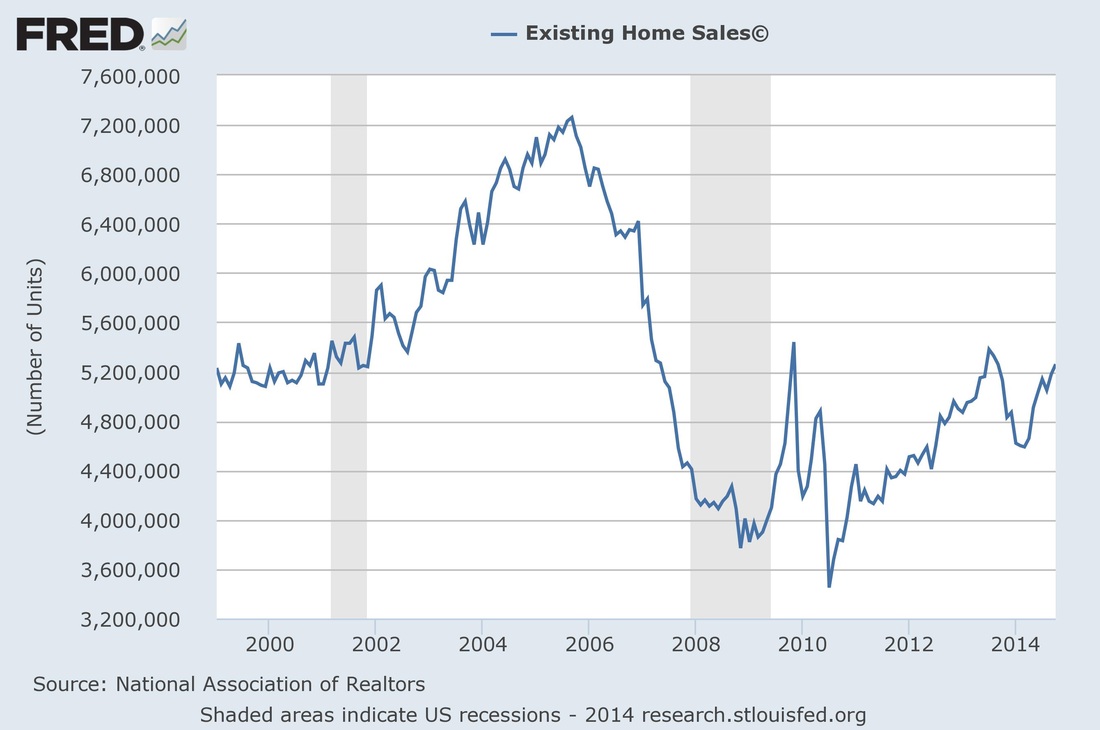
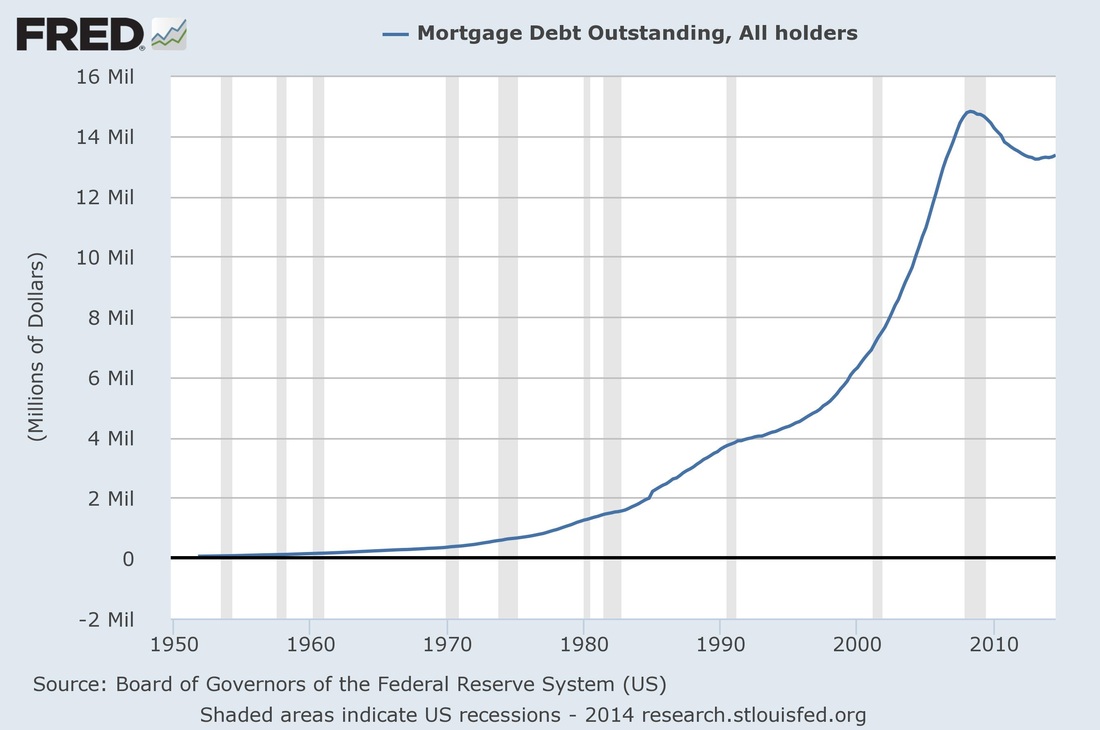
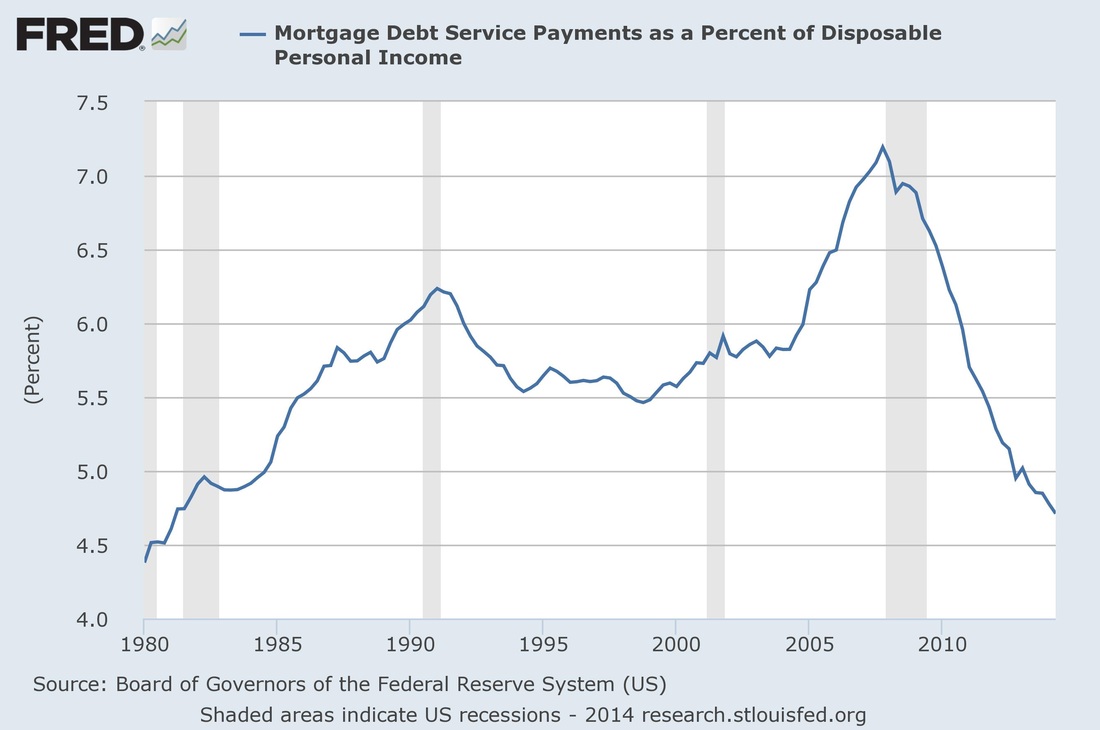
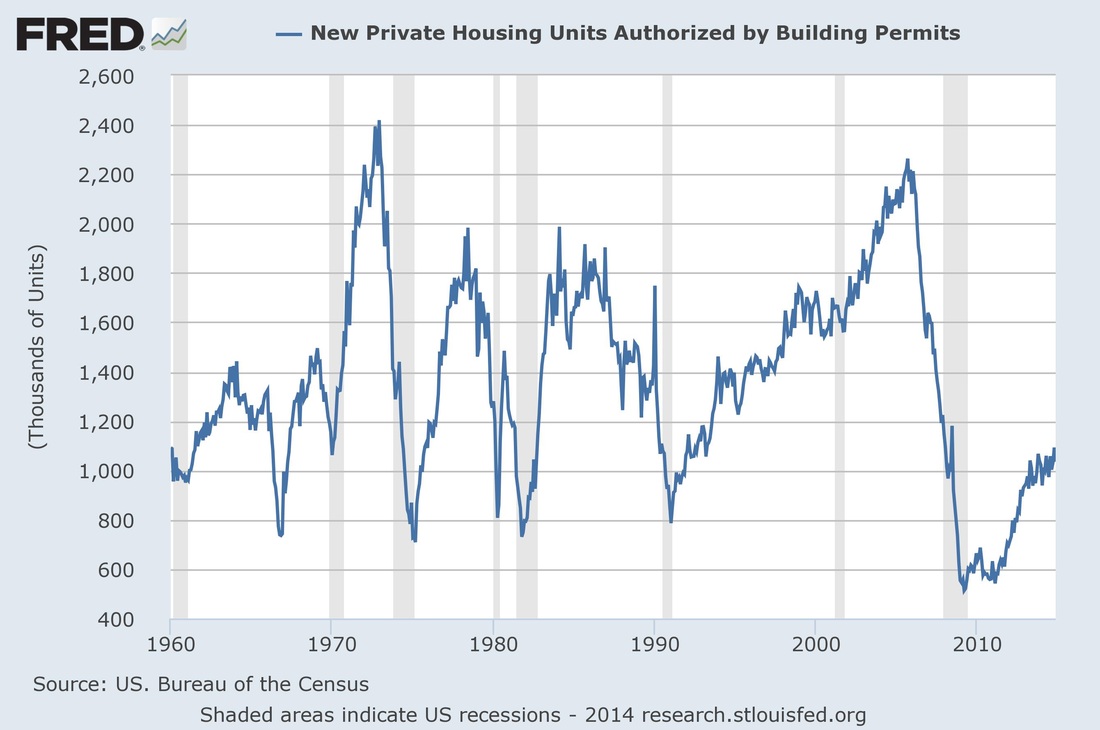
For more in-depth analysis of home prices, consider the home rent to price ratio.
Manufacturing
Manufacturing
